


If you are a numbers nerd or love data (data never lies), you’ll love these digital marketing statistics that I have gathered from over a dozen of studies. Gaining insight to support your cause is a necessity.
Here, we’ve compiled 36 powerful stats to help you navigate the digital marketing landscape and build a higher ROI.
Social Media
1. The most used campaign type amon all Facebook campaigns in Brand Awareness – 55% (Wordstream, 1029). Brand awareness is the most used objective on Facebook.
2. Content has a 4.5% higher conversion rate (Sprout Soical, 2017).
3. 30% of marketers are using last-click attribution to conversion (Wordstream, 2019).Attribution models used by marketers in 2019.
4. Phones and tablets combined produce 74% of retailer Google search ad clicks in Q1 2019, an eight-point increase from a year earlier (Merkle, Digital Marketing Report Q1 2019).
5. 86%of women will research on social media before making a purchase. (Disruptive Advertising, 2018).
6. 75% of marketers say that their social media marketing efforts have led to increased traffic. (Ignite Visibility, 2018).
7. Instagram has 84x more engagement than Twitter and 10x more than Facebook. (Ignite Visibility, 2018).
Businesses have the opportunity to get in front of customers and create deep emotional engagement with their brands. A significant driver of sales is understanding your customers and creating more personalized content for them. Don’t let potential customers skip over your ads. Check out these hacks that can help you keep your ads fresh and the Facebook ad fatigue at bay.
eCommerce
8. Average eCommerce conversion rates are 1% – 2%. Even if you are doing everything right, you can still expect to win the sale around 2% of the time (BigCommerce 2017)
9. For the majority of online transactions, the path from awareness to conversion is very short — 71% of consumers make their purchase within a week of awareness or desire (KPMG Global Survey – the truth about consumers 2017)The path from awareness to conversion is very short.
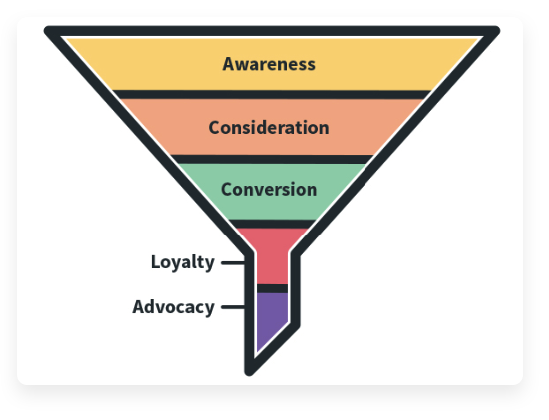
The path from awareness to conversion is very short.
The path from awareness to conversion is very short.10. Less than half (43%) of companies with online stores report seeing significant traffic from social media (MarketingSherpa ecommerce benchmarks 2017).
11. In Q2 2018, total digital commerce has grown to account for over 1 in every 6 discretionary dollars spent by consumers (Smart Insights, Q4 2017 Online Marketing Statistics).
12. Consumers in Australia, New Zealand, Canada, France, Belgium, and South Africa were most likely to be influenced by price or promotions. In these countries, more than 38 % of consumers said price and promotions were the factors that drove their most recent product choice (KPMG Global Survey – the truth about consumers 2017)Price and promotions drive 38% consumers to make their most recent product choice.

Price and promotions drive 38% consumers to make their most recent product choice.
13. Price and promotions drive 38% consumers to make their most recent product choice.13. 22% of omnichannel sellers sell through other marketplaces (including Amazon, Etsy, eBay, etc. (BigCommerce 2017).
14. E-commerce is growing 23% year-over-year, yet 46% of American small businesses do not have a website (BigCommerce 2017).
15. 37% of online spend in the US and Europe is now made through Amazon. This figure is 57% for US consumers (Salmon 2017).
Content
16. 53% of marketers say blog content creation is their top inbound marketing priority. (HubSpot, State of Inbound) Top challenges faced by marketers in 2019.

Top challenges faced by marketers in 2019.
17. Top challenges faced by marketers in 2019.17. Top five B2B content marketing tactics: Social media content (92%); Newsletters (83%); articles on your website (81%); blogs (80%); in-person events (77%). (IMN Inc.)About half B2B marketers rate their content marketing strategy as ‘moderately effective’.

About half B2B marketers rate their content marketing strategy as ‘moderately effective’.
18. About half B2B marketers rate their content marketing strategy as ‘moderately effective’.18. 54% of B2B marketers rate their content marketing strategy as ‘moderately effective’ (Smart Insights)
19. Marketers believe research reports (46%) generate leads with the highest customer conversion rate (Ascend2 – Lead Generation to increase conversions report)
20. Brands spend 25%-43% of their marketing budget on content. (MarketingProfs, 2018)
21. Digital asset management is now essential to marketing, as visual storytelling.

Visual content is a must-have.
Visual content is no longer nice-to-have – it’s a must-have. It makes your content more memorable and builds trust among consumers. Visual content just might be the deciding factor between you and a competitor. In Hunch Studio you can create beautiful dynamic templates that can generate thousands of ads from your product catalog feed directly to Facebook users most likely to engage.
SEO
22. Total site sessions produced by organic search declined by about 2% in Q1 2019, down from 2% growth in Q4 2018 (Merkle, Digital Marketing Report Q1 2019).
23. Mobile accounted for over 50% of all organic search visits in Q1 2019, the first time passing that milestone (Merkle, Digital Marketing Report Q1 2019).
24. Google has a 92.42% search engine market share as of April 2019 (StatCounter, 2019). Organic search is declining.

Organic search is declining.
25. Organic search is declining.25. In the past year, organic search visits are down about 1 point, with paid search and social media seeing the most significant increase in visits among major channels (Merkle, Digital Marketing Report Q1 2019).
26. 61% of marketers say growing SEO/organic presence is a high inbound marketing priority (HubSpot, State of Inbound 2018).
27. Ranking first on SERPs is more important than ever. On desktop rank 1 achieves an average CTR of 19.3% compared to rank 10 with 2.2% CTR. Similarly on mobile, rank 1 achieves 27.7% CTR and 2.8% for rank 10 (seoClarity, CTR study 2019). SERP features can help you with that.

Ranking first on SERPs is more important than ever.
28. Ranking first on SERPs is more important than ever.28. Businesses that show up on the first page of results get 92% of consumer traffic (Joal House 2019).
PPC
29. One-third of respondents (33%) click on a paid search ad because it directly answers their search query (Clutch, Search Engine Marketing: Why People Click on Paid Search Ads, 2019).Some of the reasons why people click on paid search ads.

Some of the reasons why people click on paid search ads.
30. Some of the reasons why people click on paid search ads30. Just 8% of advertisers are decreasing their advertising investments on Search this year; this compared to a whopping 46% that are increasing them (WordStream 2019)Google investment trends from 2018-2019.

Google investment trends from 2018-2019.
31. Google investment trends from 2018-2019.31. Businesses make an average of $2 in revenue for every $1 they spend on Google Ads. (Google Economic Impact Report).
32. Google display campaigns reach 80% of global internet users (Google Benchmarks and Insights).
33. Nearly two-thirds of people (63%) are most likely to click on a Google search advertisement. The number of people who are most likely to click on search ads on other sites – Amazon (15%), Youtube (9%), and Bing (6%) – is less than half of the number who are most likely to click on Google search ads (Clutch, Search Engine Marketing: Why People Click on Paid Search Ads, 2019).
34. 70% of millennials like it when they can click on a product from an ad. (Google, 2018).
35. People who visit a website after clicking on a PPC ad are 50% more likely to make a purchase compared to visitors who clicked on an organic search result (Wordlead, 2019).
36. On average, most businesses see a 200% return on their investment when purchasing Google Ads (Power Traffick, 2019).
Conclusion:
So there you have it, 36 powerful stats at your fingertips. In what direction will you lead your marketing strategy?
Visual content just might be the deciding factor between you and a competitor. In Hunch Studio you can create beautiful dynamic templates that can generate thousands of ads from your product catalog feed and automate them with rules.
Schedule a FREE strategy call to find out how Hunch can help you achieve your campaign goals.